Internet sales reports can be based on better interactive and visual panels than static reports. Thanks to these control panels, detailed information can be obtained about which product was sold, in what quantity, and sales trends over time can be analyzed.

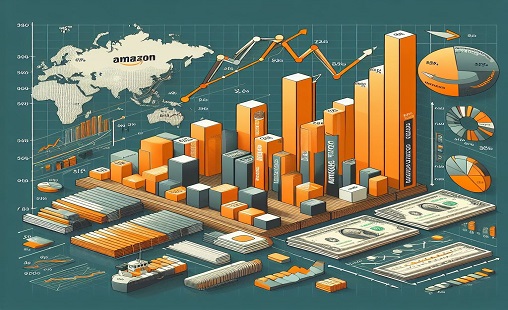
This project is to transform raw sales data into interactive and visually appealing dashboards using Pandas DataFrames for analysis.

This project shows interactive reports showing the percentage of monthly sales attributed to Repeat customers.
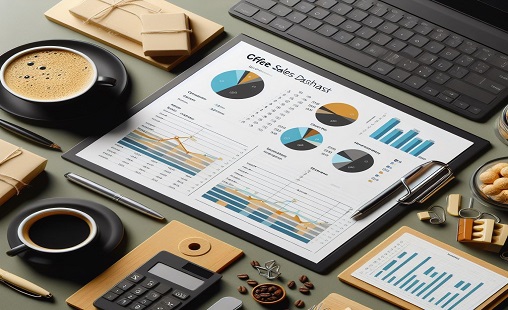
This Excel project aims to design a sales dashboard focusing on four different types of coffee and three different countries.